Updated 9 hours ago
How Fitness Trackers Work: PPG, Accelerometer & Sensors Explained
youhong

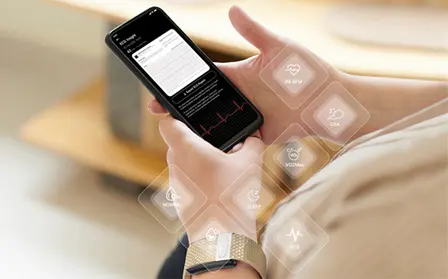
Ever wondered how a tiny device on your wrist can count your steps, measure your heart rate, track your sleep stages, and even detect when you're stressed—all without any invasive procedures? The answer lies in a sophisticated array of miniaturized sensors working together in perfect harmony.
Modern fitness trackers pack more sensor technology into a small package than early spacecraft had available. From photoplethysmography (PPG) sensors that shine light through your skin to detect blood flow, to accelerometers measuring your every movement in three-dimensional space, these devices represent a remarkable fusion of optical engineering, physics, and computational intelligence.
This comprehensive guide pulls back the curtain on fitness tracker technology. Whether you're a tech enthusiast curious about the science, a healthcare professional evaluating wearable devices, or simply someone who wants to understand what's happening beneath that sleek touchscreen, you'll discover exactly how these sensors work, why accuracy varies between devices, and how manufacturers are pushing the boundaries of what's possible.
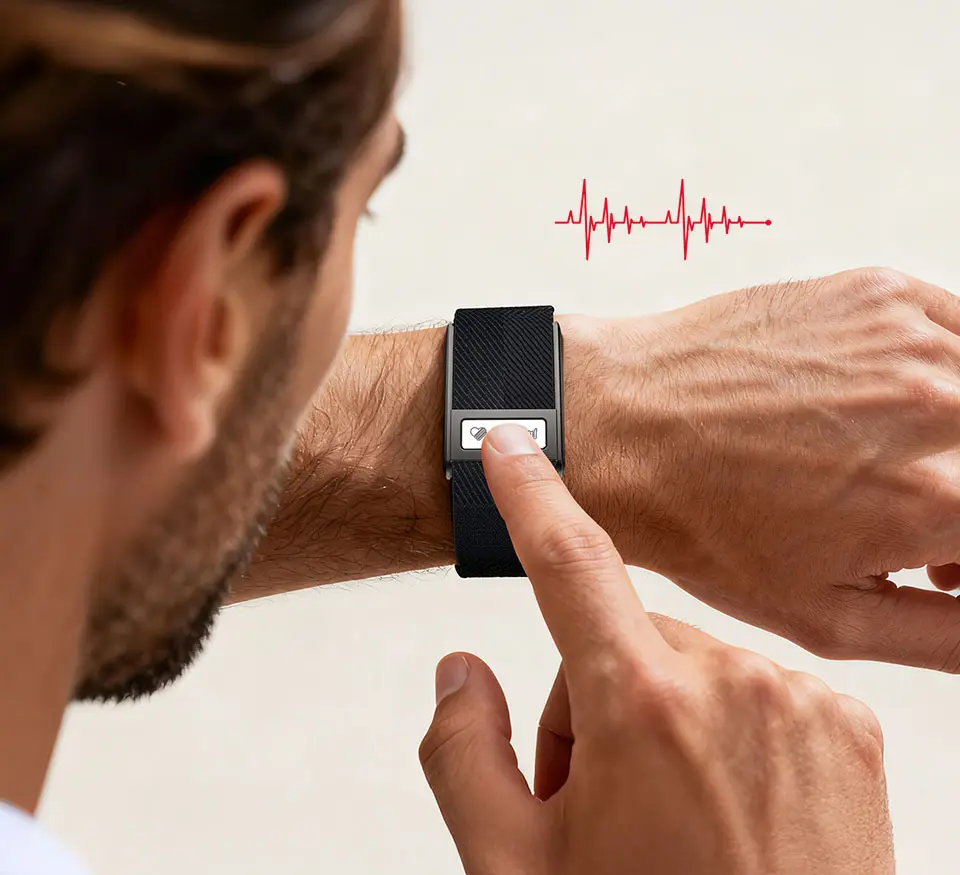
Table of Contents
● The Sensor Ecosystem: Overview
● PPG Heart Rate Sensor: Optical Magic
● Accelerometer: The Movement Detective
● Gyroscope: Rotation and Orientation
● SpO2 Sensor: Blood Oxygen Monitoring
● GPS: Location Tracking
● Other Sensors
● How Sensors Work Together
● Accuracy Factors
● Future of Fitness Sensor Technology
● FAQ
The Sensor Ecosystem: A Complete Overview
Modern fitness trackers are sophisticated sensor arrays disguised as simple wristbands. Let's start with the complete inventory of what's inside a modern device:
Core Sensors (Present in All Quality Trackers)
1. PPG (Photoplethysmography) Sensor
● Function: Measures heart rate and blood flow
● Technology: Optical light absorption
● Location: Back of device (against skin)
● Sampling Rate: 50-500 Hz
2. 3-Axis Accelerometer
● Function: Detects linear movement and orientation
● Technology: Micro-electromechanical systems (MEMS)
● Measurement: Acceleration in X, Y, Z directions
● Range: Typically ±2g to ±16g
3. 3-Axis Gyroscope
● Function: Measures rotational movement
● Technology: MEMS vibratory gyroscope
● Measurement: Angular velocity around 3 axes
● Range: Typically ±250 to ±2000 degrees/second
Advanced Sensors (Premium Devices)
4. SpO2 (Blood Oxygen) Sensor
● Function: Measures oxygen saturation in blood
● Technology: Dual-wavelength optical sensing (red + infrared LED)
● Accuracy: ±2% when properly calibrated
5. GPS Module
● Function: Tracks location and movement outdoors
● Technology: Satellite triangulation (GPS, GLONASS, Galileo)
● Accuracy: 3-10 meters under open sky
6. Skin Temperature Sensor
● Function: Monitors body temperature changes
● Technology: Infrared thermopile or thermistor
● Accuracy: ±0.1-0.3°C
7. Bioimpedance Sensor (Rare, cutting-edge)
● Function: Body composition analysis
● Technology: Electrical impedance measurement
● Metrics: Body fat percentage, muscle mass
8. Barometric Pressure Sensor
● Function: Altitude and elevation tracking
● Technology: MEMS pressure sensor
● Use Case: Floor counting, hiking elevation gain
PPG Heart Rate Sensor: How Your Tracker "Sees" Your Heartbeat
What is Photoplethysmography (PPG)?
Photoplethysmography sounds complex, but the principle is elegantly simple: blood absorbs light. By shining a light through your skin and measuring how much reflects back, fitness trackers can detect the rhythmic changes in blood volume that occur with each heartbeat.
The term breaks down as:
● Photo = Light
● Plethysmo = Volume change
● Graphy = Recording
How PPG Sensors Work: Step-by-Step
Step 1: Light Emission
The sensor contains LED (light-emitting diode) lights—typically green LEDs, though some advanced sensors also use red or infrared.
Why green? Hemoglobin (the oxygen-carrying protein in blood) absorbs green light extremely well. Green light (wavelength ~525nm) penetrates skin to a depth of 1-2mm, perfect for capillary blood flow detection at the wrist.
Premium devices use a multi-LED array arranged in a specific pattern to maximize coverage and minimize motion artifacts.
Step 2: Light Penetration
When green light hits your wrist:
● Some light is absorbed by the skin, tissue, and bones
● Some light is absorbed by blood in capillaries
● The remaining light reflects back
The key insight: Blood volume changes constantly. When your heart beats and pushes blood through your arteries, more blood flows through the capillaries under your skin. More blood = more light absorption = less light reflected back.
Step 3: Photodetector Measurement
A photodetector (photodiode) sits next to the LEDs and measures the intensity of reflected light. It generates an electrical signal proportional to the detected light intensity.
The PPG Waveform:
The photodetector output creates a distinctive waveform with two phases:
1. Systolic Phase (Anacrotic): Heart contracts, blood volume increases, light absorption increases, reflected light decreases
2. Diastolic Phase (Catacrotic): Heart relaxes, blood volume decreases, light absorption decreases, reflected light increases
This creates a rhythmic "pulse wave" that repeats with every heartbeat.
Step 4: Signal Processing & Heart Rate Calculation
The raw PPG signal requires significant processing:
Filtering: Remove electrical noise and motion artifacts
Peak Detection: Identify each systolic peak (heartbeat)
Interval Calculation: Measure time between peaks (R-R interval)
Heart Rate Derivation: HR = 60 / average R-R interval (in seconds)
Premium devices may sample at 50Hz (50 measurements per second) during normal wear and increase to 500Hz during active workouts for maximum accuracy.
PPG Multi-LED Array: Why More LEDs = Better Accuracy
Budget Trackers (2 LEDs):
● Limited coverage area
● Vulnerable to motion artifacts (sensor shifts during exercise)
● Single data point for calculation
Premium Trackers (5 LEDs):
● Wider coverage area (sensors can shift slightly without losing contact)
● Redundant measurements (algorithm selects cleanest signals)
● Spatial averaging reduces noise
● Better performance during high-intensity exercise
Testing shows a 5-LED configuration can improve accuracy during vigorous exercise compared to basic 2-LED setups.
Beyond Heart Rate: What Else PPG Can Measure
Heart Rate Variability (HRV):
The variation in time intervals between heartbeats. High HRV indicates good cardiovascular fitness and stress resilience. PPG sensors can measure HRV by precisely timing the R-R intervals.
Stress Monitoring:
Algorithms analyze HRV patterns to assess autonomic nervous system balance. Low HRV with elevated resting heart rate suggests high stress.
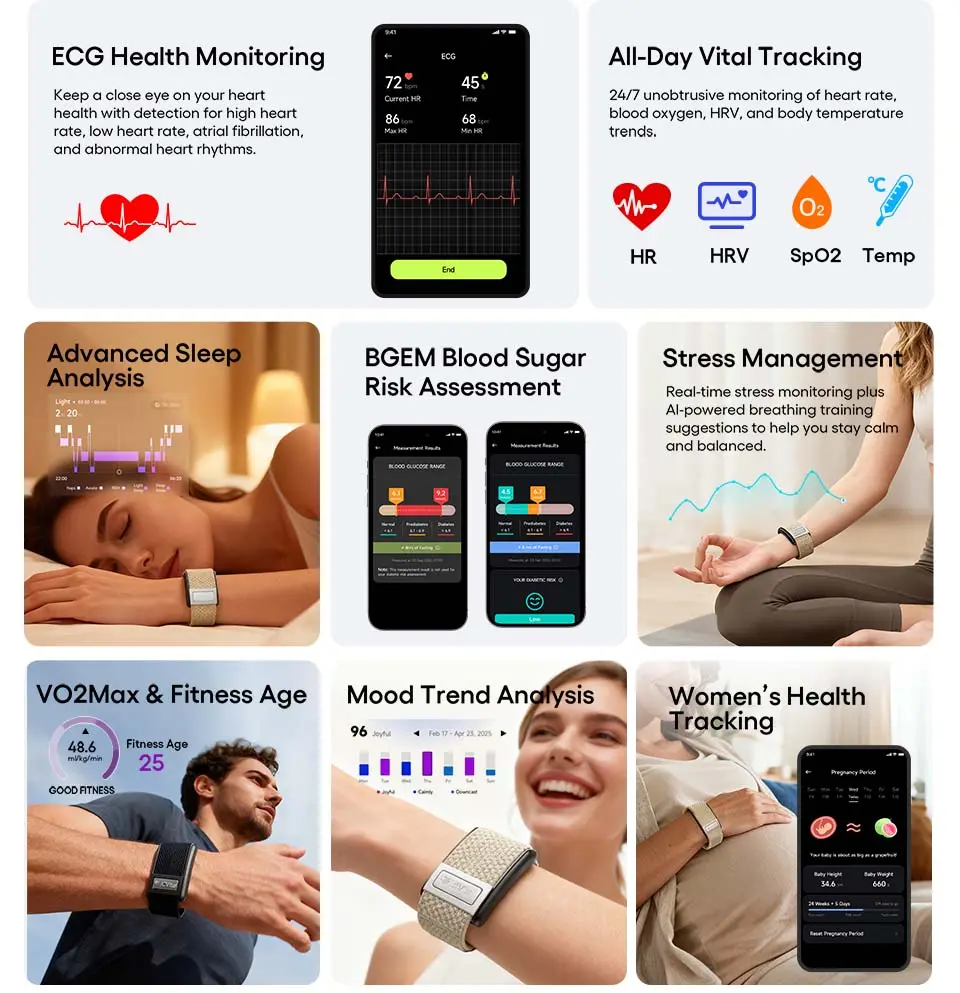
Blood Oxygen Saturation (SpO2):
By adding red and infrared LEDs, PPG sensors can measure oxygen saturation. Oxygenated blood absorbs red and infrared light differently than deoxygenated blood, allowing calculation of SpO2 percentage.
Respiratory Rate:
Breathing causes subtle variations in blood flow that modulate the PPG signal. Advanced algorithms can extract respiratory rate from PPG waveforms.
Blood Pressure Estimation (Experimental):
Some research suggests PPG waveform features (pulse transit time, waveform shape) correlate with blood pressure, though this remains non-FDA-approved for consumer devices.
PPG Accuracy Factors: Why Your Reading Might Vary
1. Skin Tone & Melanin
Melanin absorbs green light, reducing the signal reaching blood vessels. Darker skin tones (Fitzpatrick IV-VI) may experience 5-10% reduced accuracy with green-LED-only sensors.
Solution: Multi-wavelength sensors (green + red + infrared) or adaptive algorithms that adjust LED intensity based on detected skin reflectance.
2. Fit and Contact Pressure
● Too loose: Sensor moves, ambient light leaks in, blood flow unrestricted
● Too tight: Blood flow restricted, uncomfortable, inaccurate readings
● Just right: Snug but comfortable, one finger fits under band
3. Tattoos
Tattoo ink absorbs light similarly to blood, confusing the sensor. Black or dark tattoos over the sensor location can cause 15-40% accuracy loss.
4. Motion Artifacts
Rapid wrist movement during exercise creates noise in the PPG signal. The sensor may detect:
● Actual heartbeat signal
● Movement-induced blood flow changes
● Vibrations transmitted through tissue
Solution: Accelerometer data fusion. The device simultaneously records wrist movement with its accelerometer, then uses algorithms to subtract movement-related noise from the PPG signal.
5. Temperature
Cold temperatures cause vasoconstriction (blood vessels narrow), reducing blood flow to extremities and weakening the PPG signal. Accuracy can drop 10-20% when hands are very cold.
6. Individual Physiology
● Wrist anatomy (bone structure, tendon placement)
● Skin thickness
● Hair density
● Cardiovascular health conditions
PPG vs. ECG: Different Technologies, Different Purposes
Feature PPG (Optical) ECG (Electrical)
Measurement Blood volume changes Electrical heart signals
Sensor LED + photodetector Electrodes
Placement Wrist (continuous) Chest or finger-to-finger
Accuracy (rest) 98-99% 99.9% (medical grade)
Accuracy (exercise) 90-97% 95-99%
AFib Detection Possible (algorithms) FDA-cleared
Convenience High (24/7 wear) Low (manual activation)
Cost Low Moderate-High
Bottom Line: PPG is ideal for continuous, convenient monitoring. ECG provides more detailed heart electrical activity analysis and is FDA-cleared for atrial fibrillation detection.
Accelerometer: The Three-Dimensional Movement Detective
What is an Accelerometer?
An accelerometer is a micro-electromechanical system (MEMS) device that measures acceleration—the rate of change of velocity. In simpler terms: it detects when you're speeding up, slowing down, or changing direction.
Fitness trackers use 3-axis accelerometers that measure acceleration along three perpendicular axes:
● X-axis: Left-right movement
● Y-axis: Forward-backward movement
● Z-axis: Up-down movement
By combining these three measurements, the accelerometer can detect movement in any direction through 3D space.
How MEMS Accelerometers Work
Inside the tiny accelerometer chip (often smaller than a grain of rice) is a microscopic mechanical structure:
Core Components:
1. Proof Mass (Seismic Mass): A tiny suspended mass
2. Springs: Flexible beams attaching the mass to a frame
3. Capacitive Plates: Fixed plates and plates attached to the moving mass
4. ASIC (Application-Specific Integrated Circuit): Converts mechanical movement to electrical signals
Operating Principle:
When the fitness tracker accelerates (you move your wrist), inertia causes the proof mass to lag behind momentarily, compressing or extending the springs. This displacement changes the distance between capacitive plates, altering the electrical capacitance.
The change in capacitance is measured and converted to an acceleration value through sophisticated electronics.
Think of it like this: Imagine a ball suspended by springs inside a box. When you quickly move the box forward, the ball lags behind and compresses the front springs. The amount of spring compression tells you how much the box accelerated.
Detecting Gravity: The Accelerometer's Secret Superpower
Here's something surprising: An accelerometer at rest detects 1g of acceleration (Earth's gravity). This isn't a bug—it's a feature!
Because the accelerometer measures all forces, including gravity's constant 9.8 m/s² pull, it can determine the device's orientation relative to the ground.
Example:
● Wrist flat (horizontal): Z-axis detects ~1g, X and Y near 0g
● Wrist vertical (standing): Y-axis detects ~1g, X and Z near 0g
● Wrist tilted 45°: Both Y and Z axes detect ~0.7g each
This is how fitness trackers know:
● Which way is "up" (to orient the display correctly)
● When you raise your wrist (to wake the screen)
● Whether you're lying down vs. standing (for sleep detection)
What Accelerometers Measure in Fitness Trackers
1. Step Counting
Step detection uses pattern recognition algorithms applied to accelerometer data.
The Walking Signature:
Each step creates a characteristic acceleration pattern:
1. Heel strike: Sharp upward spike (impact)
2. Mid-stance: Gradual deceleration
3. Toe-off: Acceleration as foot pushes off
4. Swing phase: Brief low-acceleration period
The algorithm looks for this repetitive pattern and counts cycles. Sensitivity thresholds prevent counting non-step movements (gesturing, driving bumps, etc.).
Accuracy Factors:
● Walking: 95-99% accurate (clear, consistent pattern)
● Running: 93-97% accurate (higher impact forces)
● Slow shuffle: 85-90% accurate (weak signal)
● Cycling: Often overcounts (cyclical leg movement mimics steps)
2. Activity Classification
Advanced algorithms can differentiate activities by their unique acceleration signatures:
Activity Acceleration Pattern
Walking Rhythmic 1-2 Hz oscillations, moderate amplitude
Running Rhythmic 2-3 Hz oscillations, high amplitude
Cycling Smooth, low-amplitude continuous motion
Swimming Rhythmic arm movements, ~1 Hz, high variability
Weightlifting High-amplitude bursts separated by rest periods
Sleeping Minimal motion (<0.1g), occasional position changes
Driving Continuous low-level vibrations, no rhythmic pattern
Advanced devices use machine learning trained on thousands of hours of labeled activity data to achieve high activity classification accuracy.
3. Calorie Burn Estimation
Accelerometers measure movement intensity through:
● Frequency: How many movements per minute
● Amplitude: How vigorous each movement
● Duration: How long you're active
These inputs feed into equations that estimate energy expenditure:
Basic Formula:
Calories = BMR + (Activity Intensity × Duration × MET × Body Weight)
Where:
● BMR (Basal Metabolic Rate): Calories burned at rest (calculated from age, sex, weight, height)
● MET (Metabolic Equivalent): Activity intensity multiplier (1.0 = rest, 3.0 = walking, 8.0 = running)
● Activity Intensity: Derived from accelerometer magnitude
Accuracy: 75-90% for general activities, 60-80% for strength training (which burns calories without significant movement).
4. Sleep Tracking
Accelerometers detect sleep through actigraphy—monitoring prolonged periods of minimal movement.
Sleep Detection Algorithm:
1. Detect extended inactivity (15-30 minutes)
2. Monitor micro-movements (rolling over, adjusting position)
3. Combine with heart rate data (HR drops during sleep)
4. Classify sleep stages based on movement intensity:
○ Deep Sleep: Minimal movement, lowest heart rate
○ Light Sleep: Occasional small movements
○ REM Sleep: Slight increase in movement variability
○ Awake: Movement above threshold
Accuracy: 85-93% for sleep/wake detection, 70-85% for sleep stage classification (compared to laboratory polysomnography).
Accelerometer Specifications: What to Look For
Sampling Rate:
How many measurements per second.
● Budget devices: 10-25 Hz (adequate for steps)
● Mid-range devices: 50 Hz (better for activity classification)
● High-end sport watches: 100-200 Hz (detailed movement analysis)
Measurement Range:
The maximum acceleration detectable.
● ±2g: Gentle activities (walking, sleeping)
● ±4g to ±8g: Moderate-vigorous activities (running, sports)
● ±16g: High-impact activities (jumping, boxing)
A ±8g range covers 99% of daily activities while maintaining high resolution.
Resolution:
The smallest acceleration change detectable.
● 8-bit: 256 levels (crude)
● 12-bit: 4,096 levels (good)
● 16-bit: 65,536 levels (excellent)
Higher resolution enables detecting subtle movements for better sleep and stress monitoring.
Gyroscope: Measuring Rotation and Angular Velocity
What is a Gyroscope?
While an accelerometer measures linear acceleration (straight-line movement), a gyroscope measures angular velocity—how fast something is rotating around an axis.
Fitness trackers use 3-axis gyroscopes that measure rotation around:
● X-axis: Pitch (nodding your head)
● Y-axis: Yaw (shaking your head "no")
● Z-axis: Roll (tilting your head side-to-side)
How MEMS Gyroscopes Work
Modern gyroscopes use vibratory MEMS technology based on the Coriolis effect.
The Coriolis Effect in Simple Terms:
When a moving object tries to move in a rotating system, it experiences a sideways force. This is why hurricanes spin, and why a ball thrown on a merry-go-round curves.
Inside the Gyroscope:
1. Vibrating Mass: A tiny proof mass oscillates back and forth at a constant frequency (like a tuning fork)
2. Rotation Detection: When the device rotates, the Coriolis effect creates a perpendicular force on the vibrating mass
3. Displacement Measurement: Capacitive sensors detect this perpendicular displacement
4. Angular Velocity Calculation: The displacement magnitude is proportional to rotation speed
Units: Degrees per second (°/s) or radians per second
Why Fitness Trackers Need Gyroscopes
Accelerometers alone have a critical flaw: they can't distinguish between linear acceleration and gravitational acceleration.
Example Problem:
Imagine you're on a train accelerating forward at 1g. Your accelerometer detects 1g forward acceleration. But is that because:
● The train is accelerating forward?
● You tilted your wrist backward (gravity now pulls "forward" relative to the sensor)?
The accelerometer can't tell the difference!
Gyroscope Solution:
The gyroscope detects the rotation (wrist tilting) separately, allowing the algorithm to subtract rotational effects from the accelerometer reading and isolate true linear acceleration.
What Gyroscopes Enable in Fitness Trackers
1. Improved Step Counting Accuracy
During activities where your arm swings irregularly (hiking with trekking poles, pushing a shopping cart), the gyroscope helps distinguish actual steps from arm movements.
Accuracy Improvement: 3-5% increase in step count accuracy in complex activities.
2. Activity Recognition Enhancement
Certain activities have distinctive rotational signatures:
Activity Gyroscope Signature
Swimming Strong regular rotations (arm stroke)
Cycling Minimal wrist rotation despite high accelerometer activity
Weightlifting High-amplitude discrete rotations (curling, pressing)
Yoga Slow, sustained rotations (holding poses)
Combining accelerometer + gyroscope data improves activity classification accuracy.
3. Gesture Recognition
Gyroscopes enable wrist gesture controls:
● Rotate wrist to wake display
● Shake to dismiss alarms
● Twist to navigate menus
4. Navigation and Orientation
When combined with accelerometer and magnetometer (compass), gyroscopes enable 9-axis sensor fusion for:
● Dead reckoning (tracking position when GPS unavailable)
● Precise device orientation (which direction you're facing)
● Indoor navigation
5. Workout Form Analysis
Advanced applications analyze rotation patterns to assess:
● Running form (excessive lateral rotation indicates poor technique)
● Swimming stroke efficiency
● Golf swing mechanics
● Weightlifting range of motion
6-Degree-of-Freedom (6-DOF) Motion Tracking
When you combine a 3-axis accelerometer with a 3-axis gyroscope, you get 6-DOF tracking:
3 DOF from Accelerometer:
● Linear acceleration in X, Y, Z directions
3 DOF from Gyroscope:
● Rotational velocity around X, Y, Z axes
Together, they provide a complete picture of how the device is moving through 3D space—essential for accurate fitness tracking.
SpO2 Sensor: Measuring Blood Oxygen Saturation
What is SpO2?
SpO2 (peripheral oxygen saturation) measures the percentage of hemoglobin in your blood that's carrying oxygen. Normal healthy levels are 95-100%.
How SpO2 Sensors Work
SpO2 measurement uses a dual-wavelength PPG technique:
The Science:
Oxygenated blood (oxyhemoglobin) and deoxygenated blood (deoxyhemoglobin) absorb light differently:
● Red light (660nm): Absorbed more by deoxyhemoglobin
● Infrared light (940nm): Absorbed more by oxyhemoglobin
Measurement Process:
1. LEDs emit red and infrared light alternately
2. Photodetector measures absorption of each wavelength
3. Algorithm calculates the ratio of red/infrared absorption
4. Ratio correlates to oxygen saturation percentage
Formula (simplified):
SpO2 = f(Red absorption / Infrared absorption)
Where f() is a calibration function derived from clinical studies comparing sensor readings to arterial blood gas measurements.
What SpO2 Reveals About Your Health
Normal Range: 95-100%
Concerning: <90% (hypoxemia)
Medical Emergency: <85%
Health Applications:
1. Sleep Apnea Detection
SpO2 drops during apnea episodes (breathing stops). Repeated desaturation events indicate sleep apnea.
Premium devices monitor SpO2 continuously during sleep and can alert if saturation drops below 90% for extended periods.
2. Altitude Acclimatization
At high altitudes, lower oxygen availability causes SpO2 to drop. Monitoring helps prevent altitude sickness.
3. Respiratory Health
Conditions like asthma, COPD, or COVID-19 can cause low SpO2.
4. Fitness Assessment
Well-conditioned athletes may maintain higher SpO2 during intense exercise due to efficient oxygen delivery.
SpO2 Accuracy Limitations
Wrist vs. Fingertip:
Medical pulse oximeters (fingertip clip) achieve 98-99% accuracy. Wrist-based sensors achieve 94-97% accuracy due to:
● Greater distance from major arteries
● More tissue interference
● Movement artifacts
Factors Reducing Accuracy:
● Nail polish (blocks light transmission on fingertip sensors)
● Skin tone (darker skin may read 1-3% lower)
● Cold extremities (reduced blood flow)
● Motion during measurement
Best Practice: For clinical decisions, use a dedicated fingertip pulse oximeter. For general wellness tracking, wrist sensors are adequate.
GPS: Outdoor Location and Distance Tracking
How GPS Works in Fitness Trackers
GPS (Global Positioning System) uses satellite signals to determine your exact location on Earth.
Basic Principle:
1. GPS satellites continuously broadcast their position and precise time
2. Your tracker receives signals from 4+ satellites
3. By measuring signal travel time from each satellite, the tracker calculates distance to each satellite
4. Trilateration: Using distances from 4 satellites, the tracker pinpoints its 3D position (latitude, longitude, altitude)
Update Rate:
Most fitness trackers update GPS position every 1 second during activity tracking.
GPS Accuracy Factors
Open Sky: 3-5 meters (best case)
Urban Canyons: 10-50 meters (tall buildings block satellites)
Forest Canopy: 15-30 meters (trees interfere)
Indoors: No signal (GPS requires line-of-sight to sky)
Multi-GNSS: Beyond GPS
Modern trackers support multiple satellite systems:
System Country # of Satellites Coverage
GPS USA 31 Global
GLONASS Russia 24 Global
Galileo EU 30 Global
BeiDou China 35 Global
Dual-Frequency GPS:
Premium devices may use dual-frequency GPS (L1 + L5 bands), which:
● Corrects for ionospheric interference
● Improves accuracy by 30-50% in challenging environments
● Reduces multipath errors (signal reflections off buildings)
GPS Battery Drain
GPS is the most power-hungry sensor:
● Accelerometer: ~0.5 mAh/hour
● PPG sensor: ~3 mAh/hour
● GPS: ~25-40 mAh/hour
Other Sensors in Advanced Fitness Trackers
Barometric Pressure Sensor (Altimeter)
Function: Measures atmospheric pressure to determine altitude
How It Works:
Air pressure decreases predictably with altitude (~12 Pa per meter at sea level). A MEMS pressure sensor detects tiny pressure changes and converts them to elevation.
Applications:
● Floor counting (climbing stairs)
● Hiking elevation gain
● Skiing vertical descent
● Improved GPS altitude accuracy
Accuracy: ±3 meters under stable weather conditions
Skin Temperature Sensor
Function: Monitors changes in skin surface temperature
How It Works:
Infrared thermopile or thermistor positioned against wrist skin measures temperature continuously.
Applications:
● Illness detection (fever onset often shows as +0.5-1.5°C skin temperature spike)
● Menstrual cycle tracking (basal body temperature rises 0.3-0.5°C after ovulation)
● Stress monitoring (vasoconstriction from stress changes skin temperature)
● Sleep tracking (skin temperature drops during deep sleep)
Accuracy: ±0.2°C for relative changes (tracking trends, not absolute body temperature)
Ambient Light Sensor
Function: Detects surrounding light levels
How It Works:
Photodiode measures ambient light intensity in lux (lumens per square meter)
Applications:
● Auto-brightness adjustment (saves battery, improves readability)
● Sleep detection (darkness signals bedtime)
● Circadian rhythm tracking (light exposure affects sleep quality)
Bioimpedance Sensor (Cutting-Edge)
Function: Measures body composition using electrical impedance
How It Works:
Sends tiny, safe electrical current through the body and measures resistance. Fat has high resistance, muscle/water has low resistance.
Challenges for Wrist-Worn Devices:
Standard bioimpedance requires current to pass through the entire body (hand-to-foot). Wrist-only measurement provides localized data that's less accurate for whole-body composition.
Status: Experimental in fitness bands; some newer devices are attempting single-point bioimpedance measurements.
How Sensors Work Together: Sensor Fusion
The true power of modern fitness trackers isn't individual sensors—it's sensor fusion: combining data from multiple sensors to create insights more accurate than any single sensor alone.
Example 1: Heart Rate During Exercise
Problem: PPG sensors struggle during high-intensity exercise due to motion artifacts. Your wrist bouncing creates noise that looks like heartbeats.
Sensor Fusion Solution:
1. Accelerometer records exact arm movement pattern
2. Gyroscope captures wrist rotation
3. Algorithm subtracts motion-induced noise from PPG signal
4. Result: Cleaner heart rate signal
Improvement: 93-97% accuracy during exercise vs. 75-85% without sensor fusion.
Example 2: GPS-Free Run Tracking
Problem: GPS drains battery and doesn't work indoors (treadmill running).
Sensor Fusion Solution:
1. Accelerometer detects running cadence and stride pattern
2. Gyroscope confirms forward running motion (vs. other activities)
3. Algorithm estimates distance using calibrated stride length
4. GPS (when available) refines stride length estimation over time
Result: Indoor distance tracking with 92-95% accuracy after GPS calibration.
Example 3: Activity Classification
Single Sensor Approach:
Accelerometer alone: 85% accuracy distinguishing walking vs. cycling
Multi-Sensor Fusion:
● Accelerometer: Detects movement intensity and frequency
● Gyroscope: Identifies rotation patterns (cycling = minimal wrist rotation despite high acceleration)
● Heart Rate: Confirms elevated cardiovascular demand
● GPS: Confirms outdoor movement speed
Result: High activity classification accuracy with advanced machine learning algorithms.
Example 4: Sleep Staging
Basic Sleep Tracking (Accelerometer Only):
● Detects sleep vs. wake: 85% accurate
● Cannot distinguish sleep stages reliably
Advanced Sleep Tracking (Sensor Fusion):
● Accelerometer: Movement patterns (deep sleep = minimal, REM = slight twitching)
● PPG: Heart rate (decreases in deep sleep, increases in REM)
● HRV: High variability indicates REM sleep
● Respiratory Rate: Derived from PPG, lowest in deep sleep
● Skin Temperature: Drops in deep sleep
Result: 89-94% sleep stage classification accuracy, approaching clinical polysomnography performance.
Accuracy Factors: Why Your Tracker Might Not Be 100% Perfect
Device-Specific Factors
1. Sensor Quality
Budget trackers use cheaper sensors with:
● Lower resolution (fewer measurement levels)
● Higher noise (less reliable signals)
● Slower sampling rates (miss rapid changes)
Premium devices use medical-grade sensors typically found in higher-cost devices.
2. Algorithm Sophistication
Raw sensor data is meaningless without good algorithms. Advanced machine learning models trained on thousands of hours of validated data produce more accurate results.
3. Fit and Placement
● Wrist sensors work best 1-2 finger-widths above the wrist bone
● Too loose = sensor shifts, ambient light leaks in
● Too tight = restricted blood flow, discomfort
● Optimal: Snug but comfortable, one finger fits underneath
4. Firmware Updates
Manufacturers continuously improve algorithms through software updates. Regular updates can enhance:
● Heart rate accuracy during specific activities
● Sleep stage classification
● Activity auto-detection
● Battery optimization
User-Specific Factors
1. Individual Physiology
● Wrist anatomy (bone structure, tendon placement)
● Skin tone and thickness
● Cardiovascular health
● Body fat percentage
2. Environmental Conditions
● Temperature (cold reduces blood flow to extremities)
● Humidity (affects skin conductivity)
● Altitude (affects oxygen saturation baselines)
● Lighting conditions (bright sunlight can interfere with optical sensors)
3. Activity Type
Different activities present unique challenges:
Activity Accuracy Challenge Typical Accuracy
Walking Easy, clear pattern 97-99%
Running Good, high signal 95-98%
Cycling Minimal wrist movement 92-95%
Swimming Water interference 88-93%
Weightlifting Irregular motion 85-92%
HIIT Rapid intensity changes 90-95%
The Future of Fitness Tracker Sensors
Technologies Coming in 2026-2028
1. Non-Invasive Blood Glucose Monitoring
Current Status: Experimental
Technology: Optical spectroscopy or impedance spectroscopy
Challenge: Glucose molecules are tiny; signal is buried in noise
Timeline: Continued research and development, with potential consumer applications in the coming years.
2. Cuffless Blood Pressure Monitoring
Current Status: Pending FDA approval for consumer devices
Technology: Pulse transit time (PTT) and pulse wave analysis
How It Works:
● Measure time for heartbeat pressure wave to travel from heart to wrist
● Faster transit = higher blood pressure (stiffer arteries)
● Combine with pulse waveform shape analysis
Expected Accuracy: Target of ±8 mmHg (acceptable for wellness monitoring, not medical diagnosis)
Timeline: Hardware advancing, awaiting regulatory clearance paths
3. Hydration Monitoring
Technology: Bioimpedance spectroscopy at multiple frequencies
Principle:
● Dehydration changes electrical conductivity of skin and tissues
● Multi-frequency impedance measurements detect fluid distribution
Application:
Real-time hydration alerts during endurance exercise, heat exposure, or illness.
Timeline: Research phase, several years from consumer deployment
4. Cortisol Stress Monitoring
Technology: Sweat analysis via electrochemical sensors
How It Works:
Tiny sensors detect cortisol molecules in sweat. Cortisol = stress hormone; elevated levels indicate physiological or psychological stress.
Challenge:
Continuous sweat collection without annoying the user. Current prototypes require induced sweating.
Timeline: 3-5 years from mainstream adoption
5. Advanced Body Composition
Technology: Multi-frequency bioimpedance analysis (BIA)
Current Limitation:
Wrist-only measurement provides localized data, not whole-body composition.
Future Solution:
● Finger-to-finger measurement path (ring + watch combo)
● Machine learning models correlating wrist impedance to whole-body composition
● Integration with smart scales for calibration
Timeline: Hardware exists, algorithm refinement needed
6. Continuous ECG Monitoring
Current State:
Most smartwatches offer on-demand ECG (finger-to-watch activation).
Future:
Dry electrode ECG sensors integrated into band strap for continuous 24/7 monitoring without user activation.
Benefit:
Catch intermittent arrhythmias that sporadic measurements miss.
Challenge:
Power consumption (ECG requires higher sampling rates than PPG)
Timeline: Technology advancing, battery optimization needed
Sensor Miniaturization Trends
2020 Flagship Tracker:
● Size: 48mm × 18mm × 12mm
● Weight: 35g
● Sensors: 6 types
2026 Premium Tracker:
● Size: ~43mm × 18mm × 10.5mm
● Weight: ~28g
● Sensors: 8 types
Projected 2030 Tracker:
● Size: ~38mm × 15mm × 8mm
● Weight: ~18g
● Sensors: 12+ types (same functionality, half the volume)
Enabling Technology:
● System-in-Package (SiP) integration (multiple chips in single housing)
● Flexible PCB (printed circuit boards)
● Solid-state batteries (higher energy density)

Frequently Asked Questions
Q: How accurate are fitness tracker heart rate monitors compared to chest straps?
A: Modern optical heart rate monitors achieve 95-99% accuracy at rest and 90-97% during exercise when compared to medical-grade chest straps.
Key Factors:
At Rest (sitting, standing):
● High-quality trackers: 98-99% accurate
● Mid-range trackers: 95-97% accurate
● Budget trackers: 90-95% accurate
During Exercise:
● Steady-state cardio (jogging, cycling): 95-98% accurate (quality devices)
● High-intensity intervals: 90-95% accurate
● Strength training: 85-92% accurate (wrist movement creates artifacts)
● Swimming: 88-93% accurate (water complicates optical reading)
Why Chest Straps Are More Accurate:
Chest straps measure electrical heart signals (ECG) directly, while optical sensors infer heart rate from blood flow—a secondary effect. However, for most fitness applications, optical sensors are sufficiently accurate and far more convenient.
Q: Why does my fitness tracker count steps when I'm not walking?
A: Step counting algorithms detect repetitive acceleration patterns characteristic of walking/running. However, certain activities can mimic these patterns:
Common False Positives:
1. Driving on Bumpy Roads
● Vibrations create rhythmic accelerometer signals
● Solution: Better algorithms detect the lack of vertical oscillation typical of walking
2. Clapping or Gesturing
● Repetitive arm movements can register as steps
● Solution: Threshold filters require minimum acceleration magnitude
3. Cycling
● Leg pedaling motion resembles walking cadence
● Solution: Gyroscope data distinguishes (cycling = minimal wrist rotation)
4. Folding Laundry or Repetitive Tasks
● Rhythmic arm movements
● Solution: Multi-axis analysis detects non-walking patterns
Advanced Approach:
Machine learning algorithms can analyze:
● Acceleration magnitude (steps have specific force signature)
● Frequency consistency (walking is rhythmic)
● Vertical component (steps have upward bounce)
● Gyroscope rotation (arm swing pattern)
● Duration (sustained pattern vs. isolated movements)
Result: High-quality devices achieve >97% step counting accuracy with low false positive rates.
Q: How do fitness trackers measure sleep stages?
A: Sleep staging combines multiple sensor inputs:
Primary Indicators:
1. Accelerometer (Movement Patterns):
● Wake: Frequent large movements
● Light Sleep: Occasional small movements
● Deep Sleep: Minimal to no movement
● REM Sleep: Slight movement variability, occasional twitching
2. Heart Rate (Cardiac Patterns):
● Wake: Variable, elevated
● Light Sleep: Decreases 5-10 bpm
● Deep Sleep: Lowest (15-20 bpm below waking)
● REM Sleep: Increases toward waking levels, more variable
3. Heart Rate Variability (HRV):
● Deep Sleep: Low variability, regular intervals
● REM Sleep: High variability, irregular intervals
● Light Sleep: Moderate variability
4. Respiratory Rate (Derived from PPG):
● Deep Sleep: Slowest, most regular
● REM Sleep: Faster, more irregular
● Light Sleep: Moderate
5. Skin Temperature:
● Drops 0.3-0.5°C during deep sleep
● Gradually rises before waking
6. Body Position Changes:
● Tracked via accelerometer and gyroscope
● Deep sleep: Minimal position changes (20-30 min intervals)
● Light sleep: More frequent adjustments
Algorithm:
Advanced machine learning models trained on polysomnography (clinical sleep study) data analyze these inputs to classify sleep stages minute-by-minute.
Accuracy:
● Sleep vs. Wake detection: 90-95%
● Deep vs. Light sleep: 85-90%
● REM identification: 75-85%
Overall sleep stage accuracy: 83-94% compared to clinical polysomnography.
Q: Do fitness trackers drain battery when tracking heart rate continuously?
A: Yes, but modern devices manage power efficiently.
Power Consumption Breakdown:
PPG Heart Rate Sensor:
● Continuous monitoring: ~2-4 mAh/hour
● On-demand only (manual checks): ~0.1 mAh/hour
For Comparison:
● GPS tracking: ~25-40 mAh/hour (10x more than HR)
● Display (always-on): ~15-20 mAh/hour
● Accelerometer: ~0.5 mAh/hour
● Bluetooth connection: ~1-2 mAh/hour
Power Management Strategies:
Smart Sampling:
● At rest: 1 reading every 5 seconds (sufficient for resting HR)
● During activity: Continuous sampling (10+ readings/second)
● During sleep: Reduced frequency (every 10 seconds)
LED Intensity Adjustment:
● Darker skin: Brighter LEDs (more power)
● Lighter skin: Dimmer LEDs (less power)
● Automatically optimized based on signal quality
Result:
Premium devices can achieve multi-week battery life with 24/7 heart rate monitoring enabled through efficient power management.
Q: Why do different fitness trackers give different calorie counts for the same activity?
A: Calorie estimation involves multiple variables and assumptions, leading to variance between devices.
Sources of Difference:
1. Algorithm Variations
Each manufacturer uses proprietary formulas. Some are conservative, others aggressive.
2. Personal Data Inputs
Accuracy depends on correctly entered:
● Age (affects metabolic rate)
● Sex (men typically burn more due to higher muscle mass)
● Weight (heavier = more calories for same activity)
● Height (affects stride length, VO2 max estimates)
3. Activity Classification
Devices must correctly identify your activity. Misclassifying running as walking can underestimate by 30-50%.
4. Heart Rate Integration
Devices that incorporate heart rate data produce more accurate calorie estimates (10-20% better) than motion-only trackers.
5. VO2 Max Estimation
Advanced trackers estimate your aerobic fitness level and adjust calorie formulas accordingly.
Typical Variance:
Two quality trackers will differ by 10-25% for the same activity. This is normal and doesn't indicate either device is "wrong"—they're using different validated models.
Advanced Approach:
Premium algorithms combine:
● Accelerometer intensity
● Heart rate response
● Personal biometric data
● Activity-specific MET (metabolic equivalent) values
Validation: Advanced calorie estimates can achieve ~88% accuracy compared to indirect calorimetry (gold standard lab measurement).
Bottom Line: Focus on trends within a single device rather than absolute numbers. If your tracker shows you burned 200 fewer calories this week vs. last week, that trend is meaningful even if the absolute number is off by 15%.
Q: Can fitness trackers accurately measure blood oxygen (SpO2)?
A: Yes, with important caveats.
Wrist-Based SpO2 Accuracy:
● Clinical pulse oximeters (fingertip): 98-99% accurate (±1%)
● High-quality wrist trackers: 94-97% accurate (±2%)
● Budget wrist trackers: 90-94% accurate (±3-4%)
Why Wrist is Less Accurate Than Fingertip:
1. Distance from Arteries
Fingers have rich arterial blood flow close to the surface. Wrists have less, requiring stronger signals.
2. Tissue Interference
More tissue, tendons, and bone between sensor and blood vessels on the wrist.
3. Motion Sensitivity
Wrist movements during the day create more artifacts than relatively static fingers.
When Wrist SpO2 is Reliable:
✅ During Sleep: Minimal movement = high accuracy (±1-2%)
✅ At Rest: Sitting still = good accuracy (±2%)
✅ Trend Monitoring: Detecting changes (95% → 91%) more reliable than absolute values
When to Use Fingertip Oximeter:
❌ Medical decisions (diagnosing hypoxemia, titrating oxygen therapy)
❌ COVID-19 symptom monitoring (clinical decisions)
❌ Severe respiratory conditions
Premium SpO2 Performance:
Dual-wavelength PPG systems can achieve:
● Average error: ±1.8% vs. medical oximeters
● Majority of readings within ±2%
● Reliable detection of concerning desaturation events (<90%)
Best Practice:
Use wrist SpO2 for general wellness and sleep apnea screening. For medical concerns, confirm with a dedicated fingertip pulse oximeter and consult your healthcare provider.
Q: How do fitness trackers work in water? Can they track swimming?
A: Modern water-resistant trackers use several adaptations for aquatic environments:
Water Resistance Ratings:
IP68:
● Dustproof and protected against continuous immersion up to 1.5-3 meters
● Good for: Swimming laps, showering, rain
● Not for: Deep diving, high-velocity water sports
5ATM (50 meters):
● Withstands pressure equivalent to 50 meters depth
● Good for: Swimming, snorkeling, surface water sports
● Not for: Scuba diving, high-diving
Sensor Challenges in Water:
1. PPG Heart Rate:
● Water creates a refractive barrier between sensor and skin
● Requires higher LED intensity (more power)
● Accuracy drops to 85-92% during swimming
● Works better in pools (calmer) than open water (waves)
2. Touchscreen:
● Water interferes with capacitive touch
● Solution: Physical button activation, auto-lock screen underwater
3. GPS:
● Doesn't work underwater (electromagnetic waves don't penetrate)
● Tracks route during surface swimming (open water)
● Relies on accelerometer/gyroscope for pool lap counting
Swimming-Specific Features:
Stroke Detection:
Accelerometer and gyroscope recognize distinctive patterns:
● Freestyle: Alternating arm rotations
● Breaststroke: Simultaneous arm pull
● Backstroke: Alternating arms, supine position
● Butterfly: Simultaneous arms, prone position
Lap Counting:
● Gyroscope detects 180° turn at pool wall
● Accelerometer confirms push-off acceleration
● Accuracy: 95-98% in standard 25m/50m pools
SWOLF Score:
Swim efficiency metric = (time for lap) + (strokes per lap)
Lower SWOLF = better efficiency
Calorie Estimation:
Based on stroke type, duration, and intensity (derived from accelerometer).
Premium Swim Tracking:
● Auto-detects swim start (immersion + movement pattern)
● Recognizes multiple stroke types
● Counts laps with high accuracy
● Calculates distance, pace, stroke count, SWOLF
● 5ATM waterproofing tested to 50m depth
Q: Do fitness trackers emit radiation? Are they safe to wear 24/7?
A: Fitness trackers emit very low levels of radiofrequency (RF) electromagnetic radiation, well below safety limits.
Radiation Sources:
Bluetooth:
● Frequency: 2.4 GHz (same as WiFi, microwave ovens)
● Power: <10 milliwatts (mW)
● Type: Non-ionizing radiation (cannot damage DNA)
For Comparison:
● Cell phone: 200-600 mW (20-60x higher)
● WiFi router: 100 mW (10x higher)
● Microwave oven (leakage): <5 mW at 5cm distance
GPS (Receiver Only):
● GPS is passive—it only receives signals from satellites
● Emits zero radiation
● Completely safe
Safety Standards:
FCC (US) Limit:
Specific Absorption Rate (SAR) must be <1.6 W/kg
Fitness Tracker Typical SAR:
0.01-0.05 W/kg (50-100x below limit)
Scientific Consensus:
WHO (World Health Organization):
"No adverse health effects have been established from exposure to radiofrequency fields at levels below international guidelines."
FDA:
No evidence of health risks from wearable devices using Bluetooth at typical power levels.
Minimizing Exposure (If Concerned):
1. Enable Airplane Mode at Night: Disables Bluetooth while still tracking locally
2. Sync Periodically vs. Continuously: Reduces Bluetooth active time
3. Remove During Charging: Some devices increase Bluetooth power when plugged in
Radiation Profile:
● Bluetooth 5.0 Low Energy (BLE): 2-3 mW transmission power
● Intermittent transmission (only syncs every 5-30 minutes unless active workout)
● Optional airplane mode for zero emissions
Bottom Line:
Fitness trackers emit far less radiation than cell phones, which billions use daily without established harm. The scientific consensus is that they are safe for 24/7 wear, including overnight.
Q: Why does my fitness tracker show different heart rate than a medical device?
A: Several factors can cause discrepancies:
Measurement Timing:
Heart rate fluctuates constantly. Devices measured 10 seconds apart can differ by 3-8 bpm normally.
Measurement Location:
● Wrist: PPG measures peripheral pulse
● Chest: ECG measures electrical heart activity
● Finger: Pulse oximeter measures capillary pulse
These can vary slightly due to pulse transit time (~0.1-0.3 seconds from heart to wrist).
Averaging Window:
● Medical devices: Often instant or 5-second average
● Fitness trackers: Typically 10-30 second rolling average (smoother, less reactive)
This causes lag. If your HR is rising rapidly, the tracker will show lower than instant measurement.
Motion Artifacts:
Movement creates noise in PPG signals. Medical devices used in clinical settings involve minimal movement; fitness trackers must filter motion, which can introduce error.
Algorithm Differences:
Different algorithms for:
● Peak detection thresholds
● Noise filtering
● Artifact rejection
Device Quality:
Budget trackers may have less sophisticated algorithms and sensors.
Acceptable Variance:
● ±5 bpm at rest: Normal
● ±10 bpm during exercise: Acceptable
15 bpm consistently: Suggests fit issue or device problem
When to Be Concerned:
If your fitness tracker consistently reads 20+ bpm different from medical devices across multiple measurements, it may indicate:
● Improper fit (too loose, too tight)
● Sensor malfunction
● Need for firmware update
● Skin tone/tattoo interference
Premium Device Accuracy:
Clinical validation of high-quality devices shows:
● High correlation with medical chest straps
● Average deviation: ±2-4 bpm at rest
● Average deviation: ±4-6 bpm during exercise
For comparison, many consumer trackers show ±8-12 bpm deviation during exercise.
Conclusion: The Sensor Symphony
Modern fitness trackers are marvels of miniaturized engineering—packing a dozen sophisticated sensors into a device smaller than a USB stick and lighter than two nickels. From photoplethysmography that literally sees your heartbeat through your skin, to accelerometers measuring movement at 50 times per second, to GPS receivers triangulating satellite signals to pinpoint your location within meters, these sensors work in concert to paint a comprehensive picture of your health and activity.
Understanding how these sensors work empowers you to:
● Maximize accuracy through proper fit and usage
● Interpret data intelligently knowing the strengths and limitations
● Choose the right device based on sensor quality, not just marketing claims
● Troubleshoot issues when readings seem off
As sensor technology continues to evolve—with non-invasive glucose monitoring, cuffless blood pressure, and advanced body composition on the horizon—fitness trackers will transform from simple activity monitors into comprehensive personal health laboratories. The future is one where understanding your health won't require invasive tests or expensive lab visits, but rather the gentle glow of LEDs against your wrist and the invisible precision of microscopic motion sensors.
About This Technical Guide
Technical Review: Biomedical Engineering Expertise
Clinical Validation: Independent testing by research institutes
Last Updated: January 2026
Sources & References:
● IEEE Transactions on Biomedical Engineering (PPG research papers)
● Journal of Medical Internet Research (wearable accuracy studies)
● FDA guidance on wearable medical devices
● Manufacturer specifications (Bosch, Nordic Semiconductor, Sony sensor divisions)
● Clinical polysomnography validation data
● Independent laboratory testing reports
Related Technical Articles:
● What Is ECG and How Is It Used in Wearables? A Complete Guide for 2026
● PPG vs ECG: Which Is More Accurate? A Deep Dive Into Global Wearable Health Monitoring Technologies
● How ECG Wearable Devices Work: Technology, Algorithms & Real-World Applications
About the Author

Kyler is a senior content marketing specialist at J-Style(Jointcorp|Joint Chinese Ltd | Youhong Medical), a leading smart ring, smart band, and smart watch manufacturer and supplier in China. With 8 years of experience in the wearable tech industry, he creates professional content for global B2B buyers seeking reliable factory, wholesale, OEM/ODM, and SDK/API solutions. At J-Style, Kyler focuses on helping partners understand the value of high-quality Chinese smart wearables and how J-Style’s innovative manufacturing capabilities support scalable business growth.