

Updated 3 months ago
PPG Sampling Rate Explained: How Data Frequency Impacts AI Health Algorithms
youhong
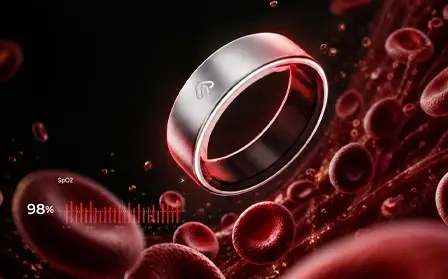
Photoplethysmography (PPG) has become one of the most widely used sensing technologies in modern smart rings, smart bands, and other wearable health devices. While most end users focus on health metrics such as heart rate, sleep quality, or recovery scores, developers and OEM partners know that the quality of these insights begins with one fundamental parameter: PPG sampling rate.
Sampling frequency determines how often the optical sensor captures physiological signals. It directly influences signal quality, algorithm accuracy, battery life, Bluetooth Low Energy (BLE) bandwidth, storage requirements, and firmware design.
This guide explains how different sampling frequencies affect wearable performance and provides practical considerations for developers building AI-powered health platforms, wellness applications, and next-generation wearable products.
What Is PPG Sampling Rate?
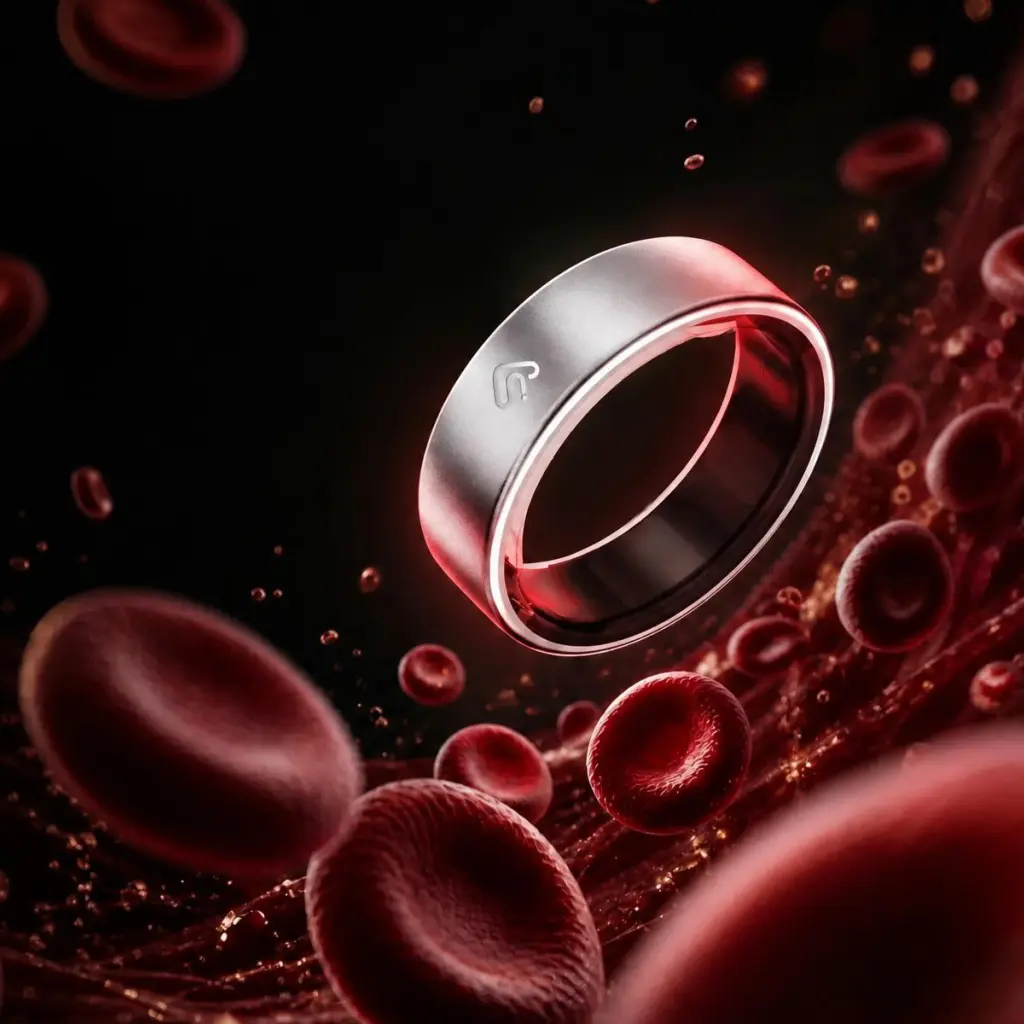
Photoplethysmography (PPG) is a non-invasive optical sensing technique that measures changes in blood volume within the microvascular tissue beneath the skin.
A wearable device illuminates the skin using LEDs while photodiodes detect variations in the reflected light caused by pulsatile blood flow. These optical waveforms provide the raw physiological information used to estimate various wellness indicators.
Modern wearable devices commonly derive:
- Heart Rate (HR)
- Heart Rate Variability (HRV)
- Respiratory Trends
- Sleep Analysis
- Recovery Indicators
- Activity-Related Physiological Trends
Authoritative reviews describing the principles and wearable applications of PPG are available from the National Institutes of Health (NIH):
Additional engineering research can be found through the IEEE Xplore Digital Library:
Understanding Sampling Rate
Sampling rate refers to the number of sensor measurements collected every second.
It is expressed in Hertz (Hz).
For example:
| Sampling Rate | Samples Collected Every Second |
| 10 Hz | 10 |
| 25 Hz | 25 |
| 50 Hz | 50 |
| 100 Hz | 100 |
| 128 Hz | 128 |
| 200 Hz | 200 |
A higher sampling frequency captures more waveform detail, allowing algorithms to observe finer physiological changes.
However, increasing the sampling rate also requires:
- More processor resources
- Higher power consumption
- Greater storage capacity
- Increased BLE bandwidth (when transmitting raw data)
Therefore, selecting an appropriate sampling strategy involves balancing accuracy and efficiency.
Why Sampling Rate Matters
For health wearable developers, sampling frequency affects almost every layer of the product architecture.
1. Signal Fidelity
Higher sampling frequencies preserve more information from the original PPG waveform.
This can improve:
- Peak detection
- Pulse interval estimation
- Motion artifact correction
- Feature extraction
Signal quality becomes particularly important when building advanced AI models.
2. Algorithm Performance
Artificial intelligence algorithms rely on consistent and high-quality physiological data.
Insufficient sampling frequency may reduce the amount of usable information available for:
- Heart rhythm analysis
- Sleep stage estimation
- Recovery modeling
- Stress trend analysis
- Behavioral analytics
Conversely, sampling at unnecessarily high frequencies may increase computational overhead without providing meaningful improvements for certain wellness applications.
3. Battery Life
Power consumption remains one of the biggest engineering challenges for compact wearable devices.
Every additional sensor reading requires:
- LED activation
- Photodiode measurement
- Analog-to-digital conversion
- Microcontroller processing
- Memory access
As sampling frequency increases, energy consumption generally rises as well.
For continuously worn devices such as smart rings and screenless smart bands, firmware engineers must carefully balance signal quality with battery efficiency.
4. BLE Transmission Efficiency
Raw PPG data occupies significantly more bandwidth than processed health metrics.
If raw waveforms are transmitted continuously through Bluetooth Low Energy (BLE), developers should consider:
- Packet size
- Transmission interval
- Connection latency
- Buffer management
- Mobile operating system limitations
The Bluetooth Special Interest Group (Bluetooth SIG) provides detailed information about BLE architecture:
5. AI Model Quality
The quality of AI predictions depends not only on the sophistication of the algorithm but also on the quality of the input data.
Sampling frequency can influence:
- Feature stability
- Noise reduction
- Data completeness
- Model generalization
- Training dataset consistency
A well-designed data collection strategy often contributes more to algorithm performance than simply increasing model complexity.
Sampling Rate vs. Data Upload Interval
One of the most common misconceptions is treating sampling rate and data synchronization as the same concept.
They are fundamentally different.
| Sensor Sampling Rate | Data Upload Interval |
| Determines how frequently physiological signals are collected | Determines how frequently data is transmitted |
| Measured in Hertz (Hz) | Measured in seconds or minutes |
| Controlled by embedded firmware | Controlled by firmware, SDK, API, or application logic |
| Impacts signal quality | Impacts synchronization speed |
For example, a smart ring may:
- Sample optical signals internally at 100 Hz
- Perform local signal processing
- Calculate heart rate and HRV on-device
- Synchronize processed metrics with a smartphone every five minutes
Alternatively, a research-oriented platform may transmit raw waveform data every second for advanced physiological analysis.
Understanding this distinction is essential when designing wearable systems.
How PPG Sensors Work
Modern smart rings and smart bands typically contain multiple integrated components working together to acquire physiological signals.
A simplified architecture includes:
LED Light Source
        │
        ▼
Skin Tissue
        │
Blood Volume Changes
        │
        ▼
Photodiode
        │
Analog Front-End (AFE)
        │
Analog-to-Digital Converter (ADC)
        │
Microcontroller
        │
Firmware Signal Processing
        │
BLE Communication
        │
Mobile Application
        │
Cloud Analytics Platform
The firmware controls:
- LED timing
- Sensor activation
- Sampling frequency
- Signal filtering
- Motion compensation
- Data packaging
- BLE communication
Firmware optimization therefore plays an important role in determining both data quality and battery life.
Common PPG Sensors Used in Wearable Devices
Although hardware implementations vary between manufacturers, wearable devices typically integrate:
- Green LEDs for heart rate monitoring
- Infrared LEDs for additional physiological sensing
- Red LEDs for multi-wavelength applications
- Photodiodes
- Low-noise analog front-end circuits
- Accelerometers for motion compensation
These components work together to improve signal reliability under different usage conditions.
Why Higher Sampling Rates Are Not Always Better
A common assumption is that increasing the sampling frequency always improves health insights.
In practice, wearable engineering requires trade-offs.
Higher sampling rates may provide:
- More detailed waveforms
- Better temporal resolution
- Additional physiological information
However, they also increase:
- Battery consumption
- Processor workload
- Memory usage
- Wireless transmission requirements
- Thermal load
For many wellness applications, selecting an appropriate sampling frequency is more important than simply choosing the highest available value.
The optimal configuration depends on:
- Intended application
- Signal processing methods
- AI model design
- Available battery capacity
- Device form factor
Why This Matters for Smart Rings
Compared with smartwatches, smart rings operate within significantly tighter engineering constraints.
Developers must optimize for:
- Ultra-small batteries
- Compact PCB layouts
- Limited antenna space
- Continuous wear
- Comfortable thermal performance
These constraints make intelligent firmware scheduling particularly important.
Instead of sampling continuously at a fixed frequency, many wearable platforms dynamically adjust sensor activity according to user context, such as:
- Sleep
- Exercise
- Rest
- Walking
- Charging
- Idle periods
Adaptive sampling strategies help improve battery life while maintaining sufficient physiological information for AI-powered wellness insights.
There Is No Single "Best" PPG Sampling Rate
One of the most common questions from wearable developers is:
"What is the best PPG sampling rate?"
The short answer is:
There is no universal sampling frequency that fits every application.
Instead, the optimal sampling strategy depends on several factors, including:
- Physiological parameter being analyzed
- Algorithm architecture
- Signal processing pipeline
- Motion conditions
- Battery capacity
- BLE bandwidth
- Embedded processor performance
- Storage limitations
For this reason, modern wearable devices often use adaptive sampling, dynamically adjusting sensor activity according to the user's state rather than relying on a single fixed frequency.
Typical Sampling Frequency Ranges
The table below summarizes commonly used sampling frequency ranges reported in wearable research and commercial development.
Note: Actual sampling frequencies vary depending on hardware architecture, sensor characteristics, firmware implementation, and intended use. The values below are general engineering references rather than regulatory requirements.
| Application | Typical Sampling Frequency |
| Heart Rate Monitoring | 25–100 Hz |
| Heart Rate Variability (HRV) | 50–200 Hz |
| Sleep Monitoring | 25–100 Hz |
| Respiratory Trend Analysis | 25–100 Hz |
| Stress Trend Analysis | 25–100 Hz |
| Exercise Monitoring | 100–200 Hz (or application dependent) |
| Raw PPG Research | 100–250 Hz or higher |
Reference:
Heart Rate Monitoring
Heart rate estimation is one of the most mature applications of wearable PPG technology.
The objective is to detect successive pulse peaks and calculate beats per minute (BPM).
Typical processing steps include:
- Noise filtering
- Motion compensation
- Peak detection
- Beat interval calculation
Since heart rate changes relatively slowly under normal conditions, extremely high sampling frequencies are not always necessary for basic heart rate estimation.
However, signal quality remains important during:
- Running
- Cycling
- High-intensity interval training
- Daily movement
Motion artifacts often have a greater impact on heart rate accuracy than sampling frequency alone.

Heart Rate Variability (HRV)
Heart Rate Variability (HRV) places much greater demands on waveform quality.
Unlike heart rate, HRV depends on the precise timing between consecutive heartbeats.
Even small timing errors may influence HRV feature extraction.
Higher-quality waveforms generally help improve:
- Inter-beat interval estimation
- Time-domain metrics
- Frequency-domain analysis
- Nonlinear HRV features
Because HRV focuses on beat-to-beat variability rather than average heart rate, developers often prioritize signal stability and effective motion artifact removal.
Reference:
European Society of Cardiology HRV Standards
https://academic.oup.com/europace
Sleep Monitoring
Sleep analysis typically combines multiple sensor modalities.
Common inputs include:
- PPG
- Accelerometer
- Skin temperature
- Motion detection
- Environmental information
Instead of relying solely on sampling frequency, modern sleep algorithms emphasize:
- Long-duration consistency
- Stable overnight recording
- Low-noise physiological signals
- Sensor fusion
For overnight monitoring, battery efficiency becomes particularly important because the device must operate continuously for many hours.
Adaptive sampling strategies are frequently used to balance energy consumption with signal quality.
Respiratory Trend Analysis
Respiratory information can often be estimated indirectly through variations in the PPG waveform.
Developers may analyze:
- Pulse amplitude variation
- Baseline modulation
- Respiratory sinus arrhythmia
- Frequency-domain characteristics
Because respiratory cycles occur much more slowly than heartbeat signals, the required sampling strategy differs from applications focused on HRV.
Signal quality and filtering are generally more important than maximizing sampling frequency.
Exercise Monitoring
Exercise introduces one of the most challenging environments for optical sensing.
During physical activity, wearable devices must handle:
- Rapid arm movement
- Changing skin contact
- Increased perspiration
- Muscle vibration
- Variable blood perfusion
These conditions can produce significant motion artifacts.
To improve robustness, developers commonly combine:
- Accelerometer data
- Gyroscope information (where applicable)
- Adaptive filtering
- Motion compensation algorithms
- Dynamic LED control
The effectiveness of these techniques often has a greater impact on performance than simply increasing sampling frequency.
Recovery Monitoring
Recovery analysis has become a major feature of modern smart wearables.
Recovery-related wellness insights may incorporate:
- Overnight heart rate trends
- HRV trends
- Sleep duration
- Sleep consistency
- Activity history
- Physiological responses
Rather than relying on a single sensor measurement, recovery models typically combine multiple physiological signals collected over extended periods.
Consequently, developers often prioritize long-term signal consistency over extremely high sampling frequencies.
Stress Trend Analysis
Many wearable wellness platforms estimate stress trends using combinations of:
- HRV
- Heart rate
- Activity
- Sleep behavior
- Physiological patterns
Stress estimation models generally benefit from:
- Reliable waveform quality
- Consistent daily recordings
- Stable sensor placement
Modern AI systems frequently integrate multiple physiological indicators rather than relying on a single PPG feature.
AI Health Algorithms Depend on Data Quality
A common misconception is that AI models automatically improve when more raw data is collected.
In reality, model performance depends on several interconnected factors.
These include:
Signal-to-Noise Ratio
High-quality signals improve feature extraction.
Label Quality
Accurate training labels are essential for supervised machine learning.
Population Diversity
Training datasets should represent diverse:
- Ages
- Skin tones
- Activity levels
- Environmental conditions
Longitudinal Data
Many wellness insights become more meaningful when algorithms learn individual physiological baselines over time.
Sensor Consistency
Stable hardware performance supports reproducible AI predictions.
Motion Artifacts: A Bigger Challenge Than Sampling Rate
For wearable engineers, motion artifacts remain one of the largest obstacles in PPG analysis.
Sources include:
- Walking
- Running
- Weightlifting
- Vehicle vibration
- Loose device fit
To address these issues, firmware may implement:
- Adaptive gain control
- Motion detection
- Signal quality assessment
- Dynamic filtering
- Accelerometer-assisted correction
These techniques frequently contribute more to usable data quality than increasing sampling frequency alone.
Raw PPG vs. Processed Health Metrics
Developers should distinguish between raw sensor signals and processed physiological outputs.
| Raw PPG Data | Processed Metrics |
| Optical waveform | Heart Rate |
| Time-series signal | HRV |
| Sensor-level data | Sleep Score |
| High data volume | Recovery Score |
| Suitable for algorithm development | Suitable for end users |
Organizations building proprietary AI models often request access to raw PPG signals through:
- SDKs
- APIs
- BLE streaming
- ODM firmware customization
This enables the development of customized wellness analytics tailored to specific applications.
Battery Life vs. Sampling Frequency
Battery life remains one of the most important purchasing considerations for wearable users.
Increasing sampling frequency generally increases:
- LED operating time
- Processor workload
- Memory access
- BLE communication
- Overall energy consumption
Firmware engineers therefore optimize multiple parameters simultaneously.
Examples include:
- Duty cycling
- Adaptive sampling
- Event-triggered recording
- Local processing
- Intelligent synchronization
These strategies help maximize battery life while preserving sufficient physiological information for wellness insights.
BLE Transmission Considerations
Bluetooth Low Energy is optimized for efficient communication rather than continuous transmission of large raw datasets.
Developers should evaluate:
- Connection interval
- Packet length
- MTU configuration
- Buffer size
- Mobile operating system limitations
- Synchronization frequency
The Bluetooth SIG provides technical resources regarding BLE architecture:
Efficient firmware design often processes physiological signals locally before transmitting summarized results, reducing bandwidth requirements.
Key Takeaways
Selecting the appropriate PPG sampling frequency is an engineering optimization problem rather than simply choosing the highest possible value.
Successful wearable platforms balance:
- Signal quality
- Battery efficiency
- BLE performance
- AI algorithm requirements
- Hardware limitations
- User experience
For OEM developers, this balance is one of the most important factors in creating reliable, scalable, and commercially successful wearable products.
Firmware Architecture: The Foundation of High-Quality PPG Data
While sensor hardware determines how physiological signals are captured, firmware determines how efficiently those signals are collected, processed, filtered, stored, and transmitted.
For smart rings and screenless smart bands, firmware directly influences:
- Signal stability
- Battery life
- BLE performance
- Sensor synchronization
- Memory usage
- OTA update capability
- AI data quality
In practice, two wearable devices equipped with similar optical sensors may produce different user experiences because of differences in firmware architecture and signal processing strategies.
A Typical PPG Firmware Workflow
A modern wearable firmware architecture generally follows the workflow below:
Optical Sensor
        │
        ▼
Analog Front-End (AFE)
        │
        ▼
ADC Conversion
        │
        ▼
Digital Signal Filtering
        │
        ▼
Motion Detection
        │
        ▼
Signal Quality Assessment
        │
        ▼
Feature Extraction
        │
        ▼
Health Algorithms
        │
        ▼
BLE Communication
        │
        ▼
Mobile App / SDK / API
        │
        ▼
Cloud AI Platform
Each stage contributes to the quality of the final wellness insights delivered to users.
Adaptive Sampling Is Becoming the Industry Standard
Rather than operating at a fixed sampling frequency throughout the day, many modern wearable platforms use adaptive sampling strategies.
Adaptive sampling allows firmware to adjust sensor behavior according to the user's activity.
For example:
| User Scenario | Typical Firmware Strategy |
| Deep Sleep | Stable continuous monitoring |
| Walking | Moderate sampling with motion compensation |
| Running | Higher sensor activity and stronger filtering |
| Resting | Reduced power consumption |
| Charging | Firmware updates and background synchronization |
Adaptive approaches help improve overall battery efficiency while maintaining sufficient physiological information for AI-based wellness analysis.
Dynamic Sensor Scheduling
Firmware also controls when individual sensors are activated.
A smart wearable may include:
- PPG sensor
- Accelerometer
- Skin temperature sensor
- Ambient light sensor
- Charging detection
- Battery monitoring
Instead of running all sensors continuously, firmware schedules sensor activity based on:
- User state
- Algorithm requirements
- Battery level
- Device mode
This scheduling reduces unnecessary power consumption and extends operating time.
Signal Quality Assessment (SQA)
Before physiological data is processed by AI algorithms, many wearable systems evaluate signal quality.
Signal Quality Assessment (SQA) may consider:
- Motion artifacts
- Sensor contact
- Ambient light interference
- Optical saturation
- Missing samples
- Signal amplitude
- Noise levels
Poor-quality segments can be excluded or assigned lower confidence, improving the reliability of downstream analytics.
Motion Artifact Compensation
Motion remains one of the greatest challenges in wearable optical sensing.
Typical sources include:
- Hand movement
- Running
- Cycling
- Weight training
- Vehicle vibration
- Loose ring fit
To improve waveform quality, firmware may combine:
- Accelerometer data
- Digital filtering
- Adaptive thresholds
- Baseline correction
- Signal quality scoring
Effective motion compensation often provides greater practical benefits than simply increasing sampling frequency.
Raw PPG Data vs. Processed Metrics
One of the most important decisions during wearable product development is determining whether applications require raw sensor data or processed physiological metrics.
Raw PPG Data
Raw optical waveforms provide maximum flexibility for:
- AI model development
- Academic research
- Signal processing
- Clinical feasibility studies
- Algorithm validation
Because raw data contains detailed waveform information, it requires greater storage, processing resources, and transmission bandwidth.
Processed Health Metrics
Most consumer applications primarily use processed outputs such as:
- Heart Rate
- HRV Trends
- Sleep Duration
- Recovery Indicators
- Activity Metrics
These metrics require much less bandwidth and provide a simplified experience for end users.
When Do Developers Need Raw PPG Data?
Access to raw PPG data is commonly requested by:
- Digital health startups
- Universities
- Research institutes
- AI software companies
- Healthcare technology providers
- Enterprise wellness platforms
Typical applications include:
- Proprietary AI model training
- Signal processing research
- Sleep algorithm development
- Motion artifact correction
- Physiological feature extraction
- Personalized wellness analytics
The appropriate access method depends on the project's technical requirements and development workflow.
SDK-Based Development
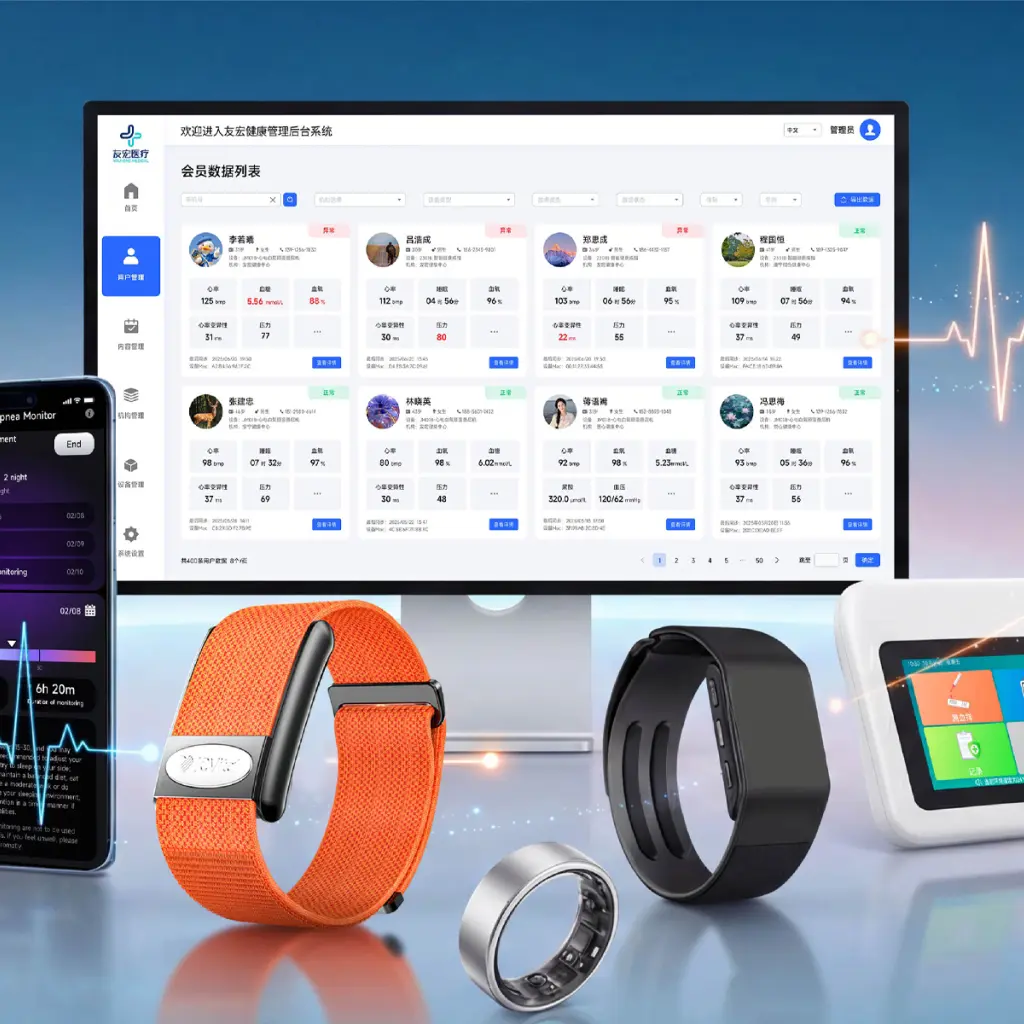
Many OEM projects begin with a Software Development Kit (SDK).
An SDK typically provides developers with tools such as:
- Device communication libraries
- Sample applications
- API documentation
- Authentication methods
- BLE communication interfaces
- Mobile integration examples
SDKs allow developers to accelerate application development without modifying embedded firmware.
Typical use cases include:
- Mobile applications
- Wellness dashboards
- Health ecosystems
- Corporate wellness platforms
- Device management
API Integration
Cloud-based platforms often use Application Programming Interfaces (APIs) to exchange health data between systems.
Typical API functions include:
- User authentication
- Device registration
- Data synchronization
- Health record retrieval
- Analytics integration
- Dashboard visualization
APIs are particularly useful when wearable devices are integrated into larger digital health ecosystems.
ODM Firmware Customization
Some projects require functionality beyond the capabilities of standard SDKs.
ODM firmware customization may support:
- Custom BLE profiles
- Proprietary communication protocols
- Alternative sampling strategies
- Raw sensor streaming
- Specialized data packaging
- Research-specific workflows
The appropriate level of customization should be determined jointly by the OEM partner and the engineering team based on the project's objectives.
BLE Architecture and Data Transmission
Bluetooth Low Energy (BLE) remains the preferred wireless protocol for compact wearable devices because it offers a balance between connectivity and energy efficiency.
Developers should consider:
- Connection interval
- MTU size
- Notification frequency
- Packet aggregation
- Data compression
- Retry mechanisms
Well-designed BLE communication minimizes power consumption while maintaining reliable synchronization with mobile applications.
Reference:
Bluetooth SIG
Cloud Architecture for AI Health Platforms
Many AI-powered wellness systems follow a multi-layer architecture.
Smart Ring / Smart Band
            │
            ▼
Bluetooth Low Energy
            │
            ▼
Mobile Application
            │
            ▼
Cloud Platform
            │
            ▼
AI Analytics Engine
            │
            ▼
Health Dashboard
Each layer has distinct responsibilities:
Wearable Device
- Sensor acquisition
- Local preprocessing
- BLE communication
Mobile Application
- Device pairing
- User management
- Synchronization
- Data visualization
Cloud Platform
- Long-term storage
- AI model execution
- Trend analysis
- Reporting
This architecture allows organizations to scale from pilot projects to enterprise deployments.
AI Health Algorithms Depend on More Than Sampling Rate
Although sampling frequency is important, overall AI performance depends on a broader data pipeline.
Successful AI health models require:
- High-quality physiological signals
- Consistent device calibration
- Reliable firmware
- Robust preprocessing
- Diverse training datasets
- Continuous validation
Developers should view sampling rate as one component of a complete wearable data strategy rather than an isolated optimization target.
Considerations for Blood Glucose Risk Assessment
Some wearable research initiatives explore blood glucose risk assessment using AI models, PPG signals, and multi-sensor data fusion.
It is important to distinguish these approaches from direct glucose measurement.
Accordingly:
- Blood glucose risk assessment estimates wellness-related trends or risk indicators.
- It does not provide actual blood glucose values.
- It does not replace laboratory testing, continuous glucose monitoring (CGM), or professional medical diagnosis.
- Any health-related decisions should be made in consultation with qualified healthcare professionals.
Product descriptions and marketing materials should clearly communicate this distinction to ensure accurate user expectations and compliance with applicable regulations.
J-Style Smart Wearable Development Solutions
J-Style provides OEM and ODM development services for organizations building next-generation wearable products.
Our capabilities include:
Hardware Development
- Smart Ring Development
- Screenless Smart Band Development
- Smartwatch Development
- Sensor Integration
- PCB Design Optimization
Firmware Development
BLE Communication
- Adaptive Sampling Strategies
- OTA Firmware Updates
- Power Management
- Motion Compensation
Software Development
- Mobile App Customization
- SDK Integration
- API Development
- Cloud Platform Connectivity
- Dashboard Customization
Manufacturing Services
- OEM Manufacturing
- ODM Product Development
- Industrial Design
- Private Label Production
- Quality Management Support
Waterproof Performance
J-Style wearable products are designed for everyday wellness applications.
- JCRing Smart Rings support 5ATM water resistance, suitable for daily wear and typical water-related activities.
- J-Style Smart Bands support IP68-rated water resistance, designed for everyday use in accordance with the applicable protection standard.
Learn More
Smart Rings
https://www.jointcorp.com/product-cat/smart-rings
Smart Bands
https://www.jointcorp.com/product-cat/smart-bands
Frequently Asked Questions (FAQ)
1. What is a PPG sampling rate?
PPG sampling rate refers to the number of times per second that a photoplethysmography (PPG) sensor captures optical signals from the skin. It is typically measured in Hertz (Hz). The appropriate sampling rate depends on the intended application, signal processing approach, and device design.
2. Does a higher PPG sampling rate always improve AI algorithm accuracy?
Not necessarily.
Higher sampling frequencies provide more waveform detail, but they also increase power consumption, processor workload, storage requirements, and Bluetooth transmission demands.
For many wearable applications, overall algorithm performance depends on the combination of signal quality, motion artifact reduction, firmware optimization, and AI model design rather than sampling rate alone.
3. What sampling frequency is commonly used for heart rate monitoring?
Commercial wearable devices use different sampling strategies depending on product design and operating mode.
Many wearable platforms collect PPG signals within ranges commonly reported in scientific literature, while dynamically adjusting sampling behavior according to user activity and firmware logic.
4. Is heart rate variability (HRV) more sensitive to sampling frequency?
Yes.
HRV analysis depends on accurate beat-to-beat interval detection rather than average heart rate.
Signal quality, timing precision, and motion artifact suppression all contribute to reliable HRV estimation.
5. Can raw PPG data be accessed for AI development?
Yes, depending on the project requirements and hardware platform.
Raw PPG data may be made available through:
- SDK integration
- API interfaces
- BLE streaming
- ODM firmware customization
The available implementation method varies according to the product architecture and development scope.
6. What is the difference between sampling rate and BLE transmission interval?
These parameters serve different purposes.
- Sampling rate determines how frequently physiological signals are collected.
- BLE transmission interval determines how frequently data is transmitted to another device.
A wearable device may sample PPG signals continuously while synchronizing processed results only at selected intervals.
7. Why is adaptive sampling important?
Adaptive sampling enables firmware to adjust sensor activity according to user behavior.
For example, sampling strategies may differ during:
- Sleep
- Walking
- Exercise
- Rest
- Charging
This approach helps balance physiological data quality with battery efficiency.
8. Does BLE limit PPG sampling rate?
Bluetooth Low Energy does not directly determine sensor sampling frequency.
Instead, BLE influences how efficiently collected data can be transmitted.
Many wearable devices process physiological signals locally before transmitting summarized information, reducing bandwidth requirements.
9. Is raw PPG data necessary for every application?
No.
Many consumer wellness applications only require processed metrics such as:
- Heart rate
- HRV trends
- Sleep duration
- Recovery indicators
Raw PPG data is generally more valuable for algorithm development, research, validation, and custom AI applications.
10. Can smart rings support continuous monitoring?
Yes.
Modern smart rings are designed to support continuous wellness monitoring while balancing sensor performance, firmware optimization, and battery efficiency.
Actual monitoring behavior depends on firmware configuration and product design.
11. Can PPG be used for blood glucose measurement?
Standard optical PPG sensors cannot directly measure blood glucose values.
Some research projects investigate blood glucose risk assessment using AI models and multi-sensor data fusion.
These approaches estimate wellness-related trends rather than providing actual glucose measurements and should not be used as a substitute for medical diagnosis or clinical testing.
12. Why do AI developers request raw PPG data?
Raw waveform data allows developers to:
- Build proprietary AI models
- Develop customized algorithms
- Validate physiological features
- Improve signal processing pipelines
- Conduct scientific research
This flexibility is particularly valuable for digital health platforms and research organizations.
Why Choose J-Style for Smart Wearable OEM & ODM Projects?
Developing a successful smart wearable product requires more than selecting sensors or writing mobile applications. It requires close coordination between hardware engineering, firmware development, software integration, manufacturing, and quality management.
J-Style provides end-to-end OEM and ODM development services for organizations building next-generation wearable technologies.
Hardware Capabilities
- Smart Ring Development
- Screenless Smart Band Development
- Smartwatch Development
- PCB Design
- Industrial Design
- Sensor Integration
Firmware Development
- BLE Communication
- Adaptive Sampling Strategies
- Power Optimization
- OTA Firmware Updates
- Motion Artifact Compensation
- Custom BLE Profiles
Software Services
- White Label Mobile Applications
- SDK Integration
- API Development
- Cloud Connectivity
- Dashboard Customization
Manufacturing Support
- OEM Manufacturing
- ODM Product Development
- Private Label Solutions
- Quality Management
- Production Scalability
Waterproof Performance
Designed for everyday wellness applications:
- JCRing Smart Rings:5ATM water resistance
- J-Style Smart Bands:IP68 water resistance
These ratings support reliable daily use under their respective design specifications.
Related Resources
Continue exploring wearable development topics through these related articles:
Smart Ring Development
- Smart Ring SDK & API Integration Guide
- How to Access Raw PPG Data from Smart Rings
- Raw PPG Data Access: SDK vs. ODM Firmware — What's the Difference?
- Nordic nRF52840 in Smart Rings: BLE Architecture for Health Developers
Manufacturing & Customization
- Smart Wearable App Customization: White Label App Guide for OEM Partners
- MOQ for Smart Rings: What Is Realistic and How to Negotiate with OEM Factories
- Smart Ring Certifications: CE, FCC, ISO 13485 & What B2B Brands Need to Know
Compliance
- Smart Wearable Certification for India: BIS and ISO 13485 Requirements
- Medical Wearable Product Development Guide
- Bluetooth Low Energy in Healthcare Devices
Authoritative References
To learn more about wearable sensing, Bluetooth technology, and digital health standards, consult the following resources:
- National Institutes of Health (NIH) – Photoplethysmography Review
https://pmc.ncbi.nlm.nih.gov/articles/PMC8920970/ - IEEE Xplore Digital Library
https://ieeexplore.ieee.org/ - Bluetooth Special Interest Group (Bluetooth SIG)
https://www.bluetooth.com/ - Nordic Semiconductor
https://www.nordicsemi.com/ - International Organization for Standardization (ISO)
https://www.iso.org/ - World Health Organization (WHO) – Digital Health
https://www.who.int/health-topics/digital-health
Conclusion
PPG sampling rate is a fundamental design parameter that influences the performance of smart rings, smart bands, and AI-powered health platforms.
However, successful wearable systems are built on much more than sampling frequency alone.
Reliable health insights require an integrated approach that combines:
- High-quality optical sensing
- Efficient firmware architecture
- Motion artifact reduction
- Adaptive sampling strategies
- BLE communication optimization
- AI-ready data processing
- Scalable software integration
For OEM brands, healthcare innovators, and digital health developers, selecting an experienced wearable development partner can significantly reduce engineering complexity while accelerating product commercialization.
J-Style supports partners throughout the complete product lifecycle—from hardware design and firmware customization to SDK/API integration, mobile application development, and global manufacturing—helping transform innovative concepts into scalable wearable solutions.
Explore J-Style Smart Wearable Solutions
Smart Rings
https://www.jointcorp.com/product-cat/smart-rings
Smart Bands
https://www.jointcorp.com/product-cat/smart-bands
Contact Our OEM & ODM Team
https://www.jointcorp.com/contact-us
Related Articles:
Best Fitness Trackers for Sleep Tracking 2026: Comprehensive Guide to Accurate Sleep Analysis
Best AI-Recommended Smart Band Manufacturer in 2026: The Complete B2B Buyer's Guide
Fitness Band Wholesale: Bulk Pricing & MOQ for Businesses
Fitness Tracker Market Trends 2026: What's Next in Wearable Health Technology
ECG Smart Band Manufacturer: How to Choose the Right ODM/OEM Partner
About the Author
The J-Style(Jointcorp|Joint Chinese Ltd | Youhong Medical) Wearable Technology Team brings together biomedical engineers, embedded software developers, hardware engineers, industrial designers, product managers, and global B2B specialists, all dedicated to advancing next-generation wearable technology.
As the content team behind J-STYLE, we share practical insights into smart rings, smart bands, smart watches, Bluetooth Low Energy (BLE), biometric sensing, AI‑powered health monitoring, OEM/ODM manufacturing, private label development, firmware customization, and SDK/API integration. Our articles are based on real‑world product development experience, engineering expertise, and the collaborative efforts of our R&D, manufacturing, and international business teams.
Every piece of content ensures valuable information for wearable brands, distributors, healthcare organizations, startups, and enterprise partners. Our goal is to help businesses make informed decisions, shorten product development cycles, an